The Picard Maneuver@lemmy.world to Memes@sopuli.xyz · 18 days agoIt would distract from the grindlemmy.worldimagemessage-square44fedilinkarrow-up1374arrow-down113
arrow-up1361arrow-down1imageIt would distract from the grindlemmy.worldThe Picard Maneuver@lemmy.world to Memes@sopuli.xyz · 18 days agomessage-square44fedilink
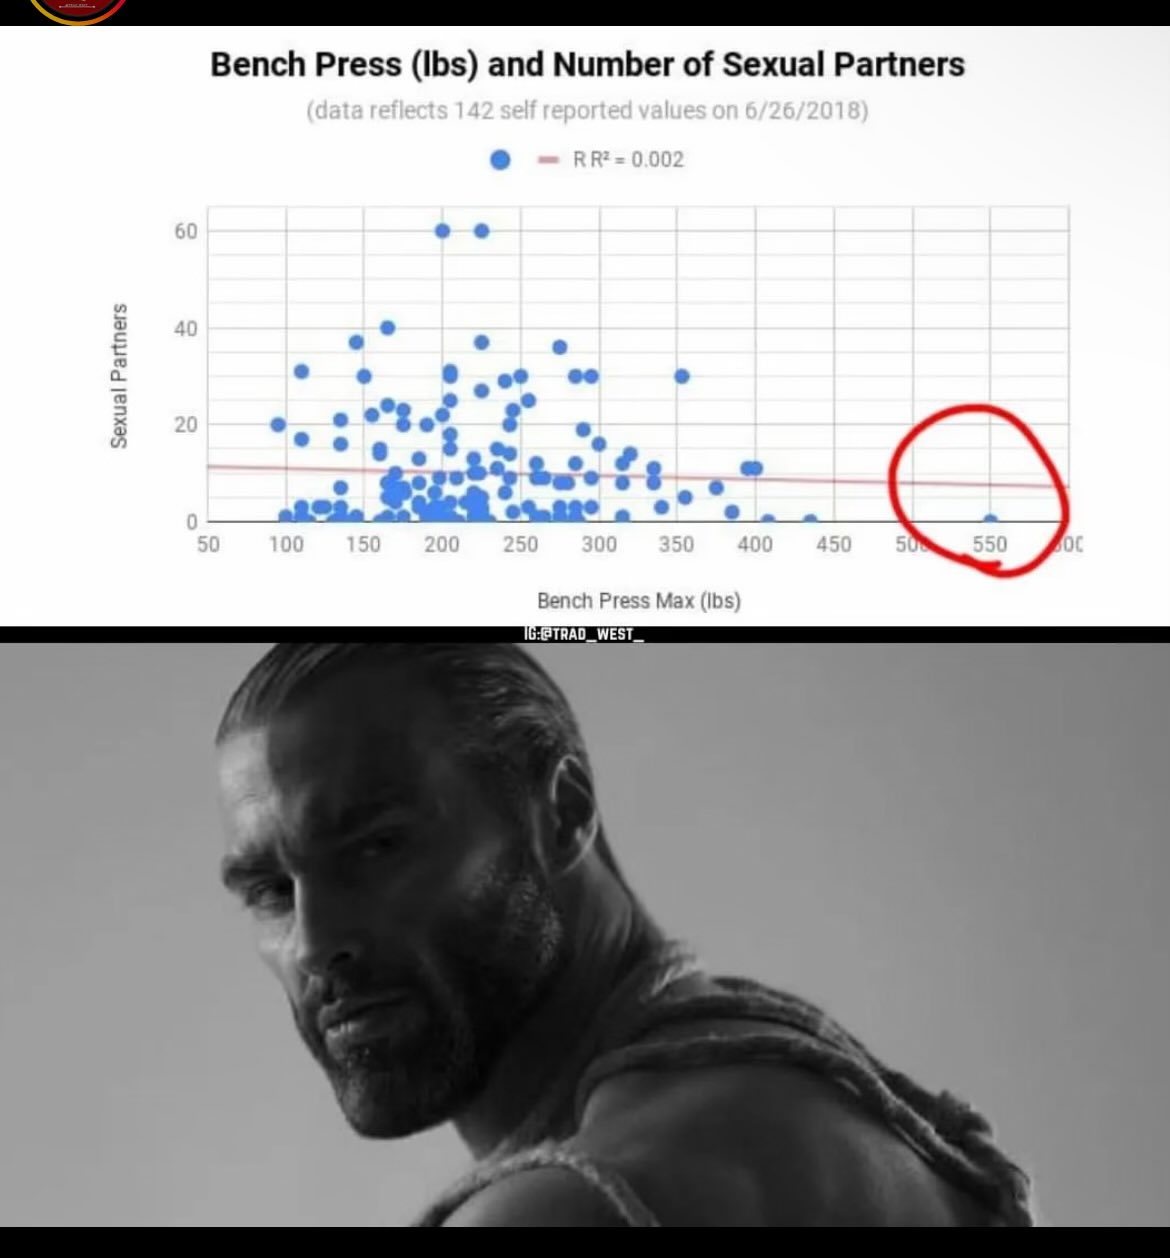
minus-squareFunkytom467@lemmy.worldlinkfedilinkarrow-up71arrow-down4·18 days agoI love that linear extrapolation you know is only there to lie even more on a graph that’s already a baseless correlation.
minus-squaredriving_crooner@lemmy.eco.brlinkfedilinkarrow-up9·18 days agoIsn’t a linear extrapolation, is a linear regression.
minus-squareProgrammer Belch@lemmy.dbzer0.comlinkfedilinkEnglisharrow-up8arrow-down1·18 days agoI thought it was an average but it is slanted. I would love to see the value of the correlation coeffitient.
minus-squarephdepressed@sh.itjust.workslinkfedilinkarrow-up21·18 days agoThe R^2 on top of the graph is 0.002 lol.
minus-squareJohnDClay@sh.itjust.workslinkfedilinkarrow-up2·17 days agoLooks more like a normal distribution peaking at the max values.


I love that linear extrapolation you know is only there to lie even more on a graph that’s already a baseless correlation.
Isn’t a linear extrapolation, is a linear regression.
I thought it was an average but it is slanted. I would love to see the value of the correlation coeffitient.
The R^2 on top of the graph is 0.002 lol.
Nice
Looks more like a normal distribution peaking at the max values.